![JN_Logo_Long-White@1x.png]](https://support.jobnimbus.com/hs-fs/hubfs/JN_Logo_Long-White@1x.png?height=40&name=JN_Logo_Long-White@1x.png)
If you do not have access to Analytics under your Insights tab, be sure to enable it in Nimbus Labs in your settings.
Opening Analytics
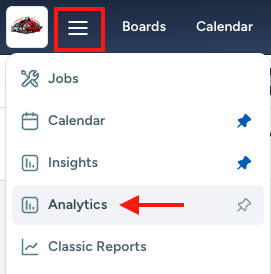
- Select the three-line menu in the top left of the page and select Analytics.
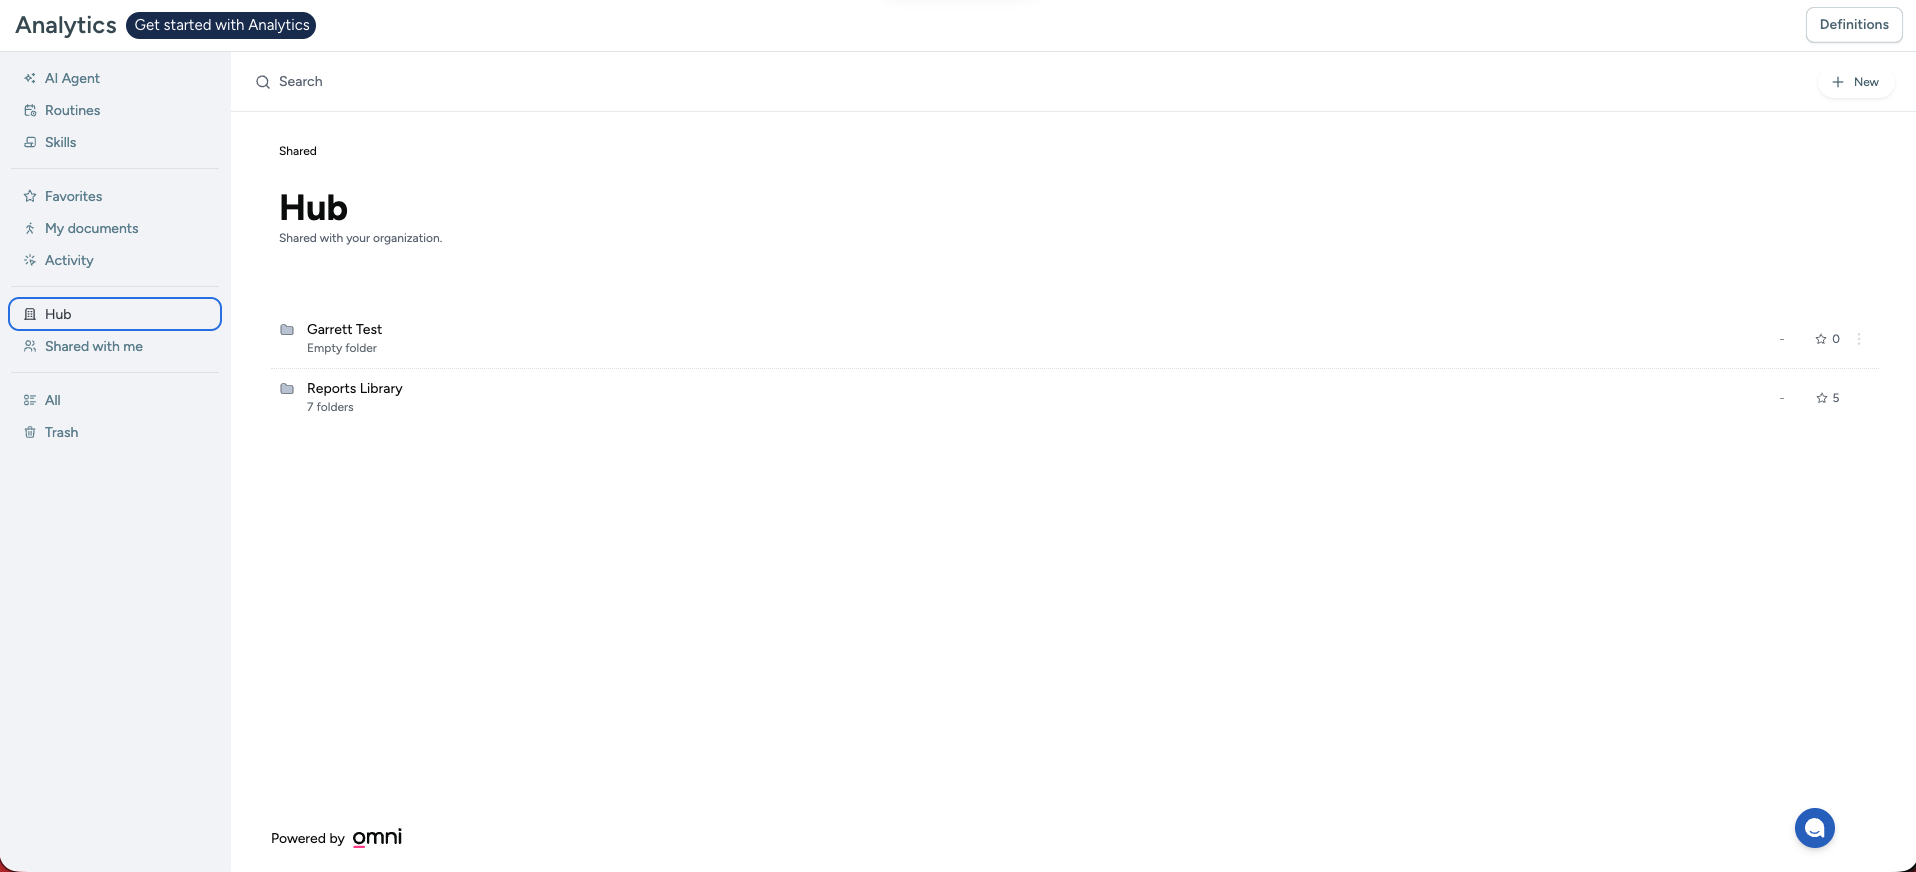
- The Hub opens, which is the Analytics landing page. It shows the Reports Library, JobNimbus's set of pre-built Verified Reports, along with any folders and custom reports your account has created.
Note: Analytics may already be pinned to your top navigation, next to your other page buttons. If so, select it there instead of opening the menu.
To add Analytics as its own button in your top navigation, so you don't need to open the menu each time, select the three-line menu, then select the pin icon next to Analytics.

Viewing a Report
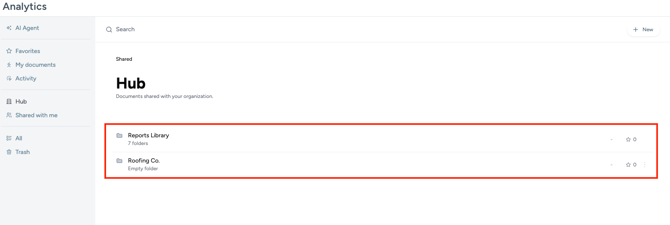
- Select a folder to view its subfolders.
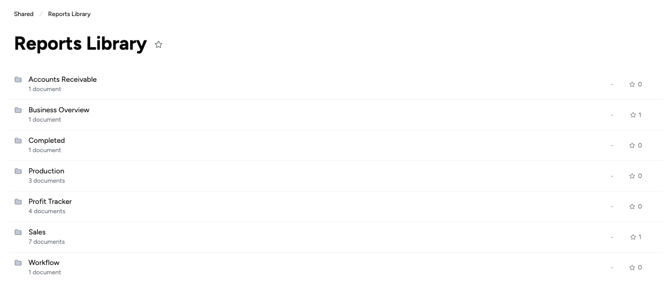
- Select a subfolder, then choose a report to open it.

A report opens as a Dashboard, the read-only view of its Charts, the individual tables and visualizations in the report.
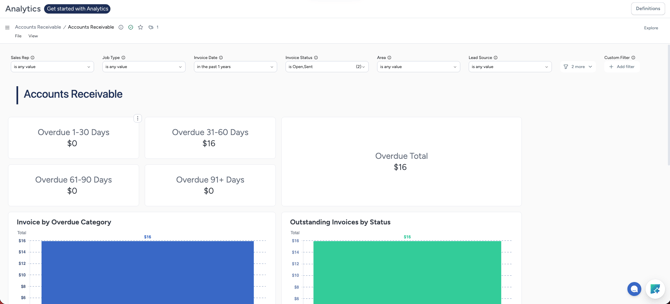
You'll also find:
- Filters at the top that you can customize. You can also add a new filter and choose from nearly any field related to the report's topic, not limited to the preset filters shown.

- Assignee data on Jobs and Contacts is now available to filter and report on, shown as a readable list of names.
- Internal notes added to an Estimate are now available as report data and can be added to a dashboard.
- The Analytics AI chatbot in the bottom right corner, if your plan includes Analytics AI

If your access profile has Hide Cost enabled, the Charts and columns in a report don't display cost, margin, or profitability data.
Note: On Analytics Enterprise, you can also open a report's Workbook, the page where you build or edit its Charts.
Using the Chart Options Menu
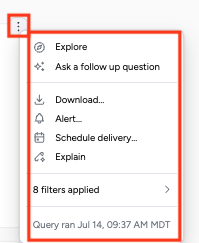
Hover your cursor over a chart to reveal a three-dot menu, and select the three dots to view additional options.These include:
- Explore: This option shows the data included in the chart, and allows you to edit what is included by selecting or deselecting options from the menu on the left.
- Ask a Follow-up Question: Opens the AI chatbot where you can ask clarifying questions.
- Download: Allows you to download the data in the chart.
- Alert: Sends an email alert to let you know if a condition is not fulfilled for a scheduled report to send successfully.
- Schedule Delivery: Schedule deliveries of reports to your inbox.
- Explain: Circle an aspect of the chart and prompt the AI chatbot to explain it further.
- Filters Applied: The number of filters applied to the report chart. Select this option to view which filters are applied.
- Query Ran...: Shows when the report query was last updated.
Using the Analytics AI Chatbot
The chatbot offers preset topics for deeper exploration, or you can type a custom question. Check out this article for example prompts.