How Does Insights Calculate My Data on the Sales Dashboard?
Explore how Insights calculates closed rate and sold amount for effective sales analysis.
To View Your Sales Data Tab
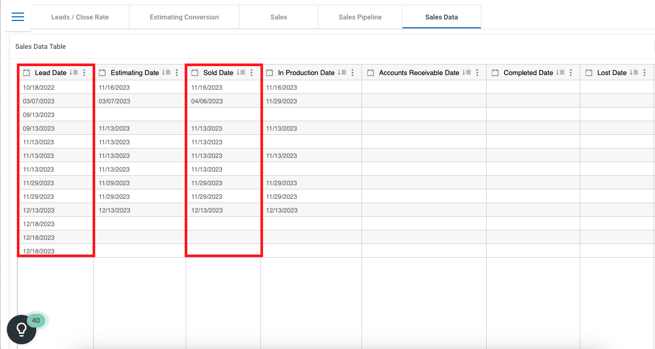
To view your Sales Data tab, click on the three lines in the top left of the Insights Dashboard, then select Sales in the resulting menu.

From here, select the Sales Data tab and scroll right on the Sales Data Table.

From there, you can navigate to view the data discussed below.
Close Rate

For instance, if there were 100 Leads collected in January and 30 of them resulted in Sold Jobs during the same month, the Close Rate for January would be 30%. Note that if a Sold Job originated from a Lead collected in a previous month, it would not be included in the Close Rate calculation for the current month.
Example
In the example below, in March there were 4 distinct Leads - Carol, Peter, Maria, and Taylor. Out of these, only 2 Leads (Carol and Peter) resulted in Sold Jobs during the month of March. Therefore, the Close Rate for March would be 50%.
JobNimbus Insights uses this definition because it is the cleanest, most predictable method of calculating your Close Rate.

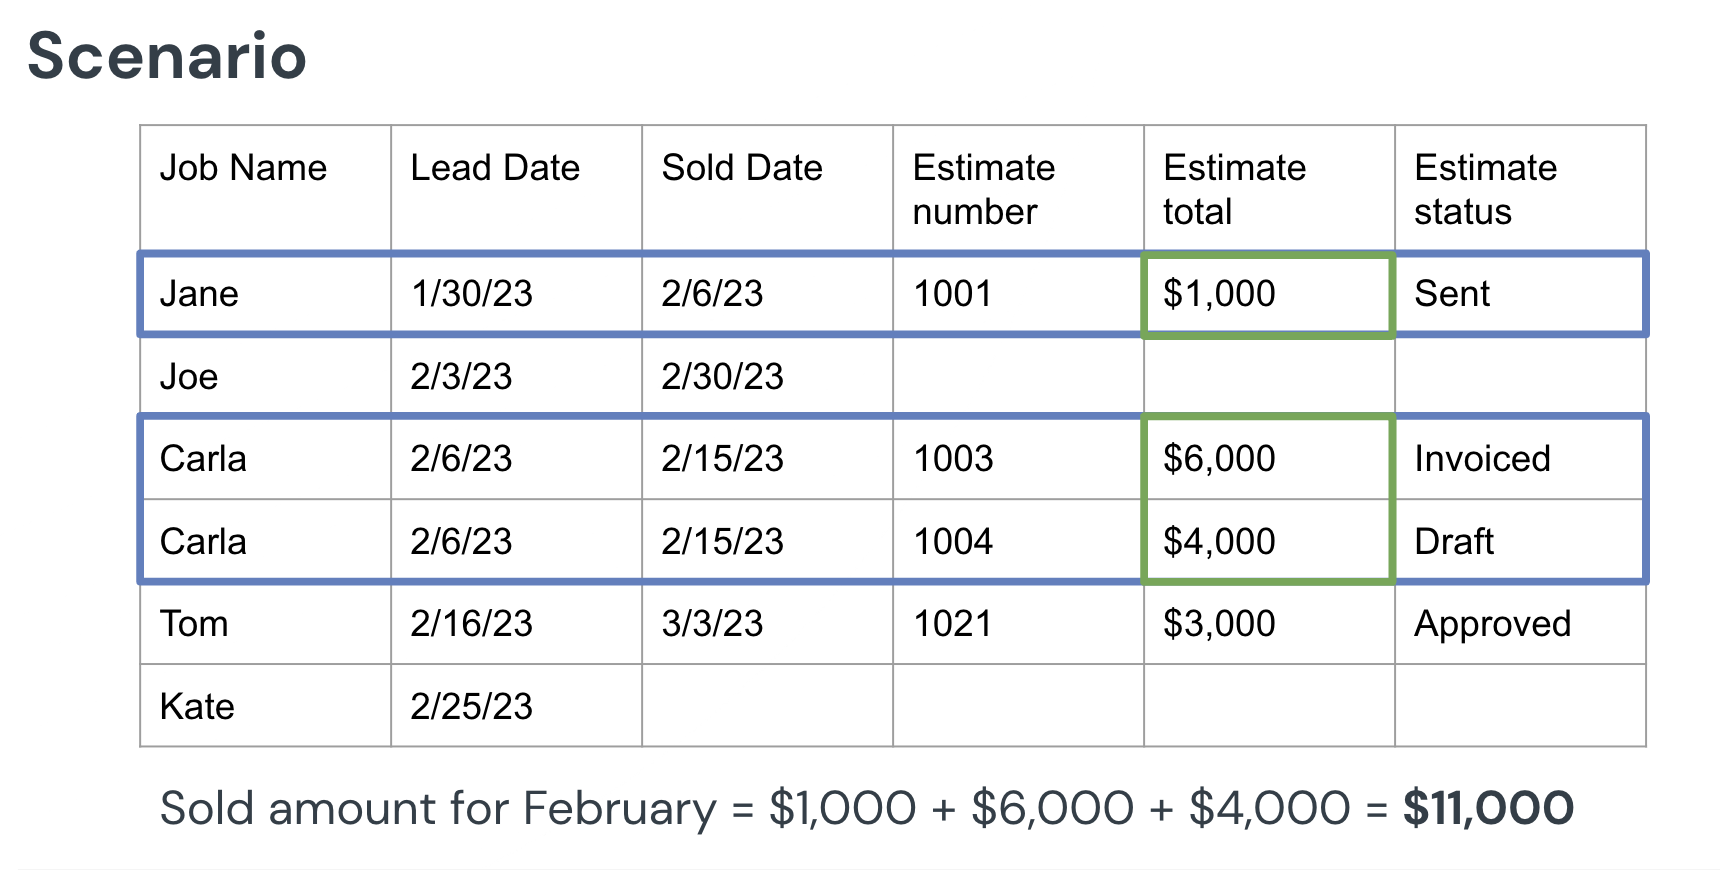
- Note: You can filter by the status of your Estimates to view different data points. More information on filters can be found in this article.
Estimating Conversion
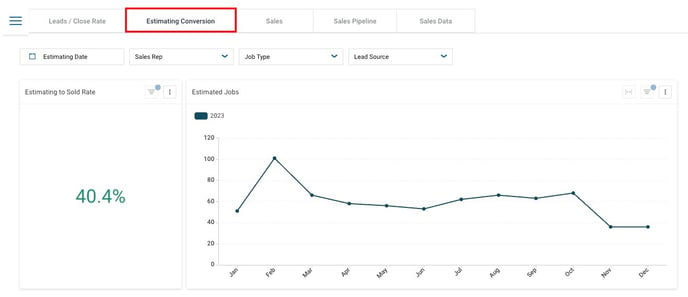
To access your Estimating Conversion data, click the tab labeled Estimating Conversion in your Sales Dashboard.

This data allow you to dive deeper into your sales funnel and understand how many of your engaged prospects are selling, while filtering out the noise of junk leads.
Estimating Conversion rates show the percentage of jobs that entered the Estimating Stage during a given timeframe and moved to the Sold Stage within that same period of time. The time frame can be edited by using your filters.