On This Page
Business Overview
The Business Overview dashboard is the first tab on your Insights page. This page is a quick overview of your business' key metrics.

Note: The Business Overview is designed to show data from the current calendar year only. Beginning each new year, the charts will initially display no data. As new business is conducted in the new year, the charts will start populating with relevant information.
Key Metrics
At the top of the Business Overview page, you will see several boxes showing your key business metrics.

- Use the dropdown menus at the top of the screen to filter by Sales Rep, Lead Source, and Job Type.
- More information on using these filters on this page can be found here.
- Download the data in any of the tables by clicking the three dots and selecting Download, then selecting the type of document you want to export it as.
- Leads account for jobs that entered the "Lead" stage during the given timeframe.
- To learn how Stages affect your Insights data, click here.
- Sold numbers on the Business Overview dashboard are based on sold jobs and the total of their related estimates in the "approved" or "invoiced" status.
- Please be aware that these numbers will only reflect correctly if you are updating your Estimates and moving them through the proper statuses. For more information about Estimate Statuses, click here.
- Close Rates show the percentage of leads collected in a given timeframe that moved to the "Sold" stage during that same timeframe.
- Estimating Conversion Rates show the percentage of jobs that entered the "Estimating" stage during a given timeframe and moved to the "Sold" stage within that same period of time.
Data Charts
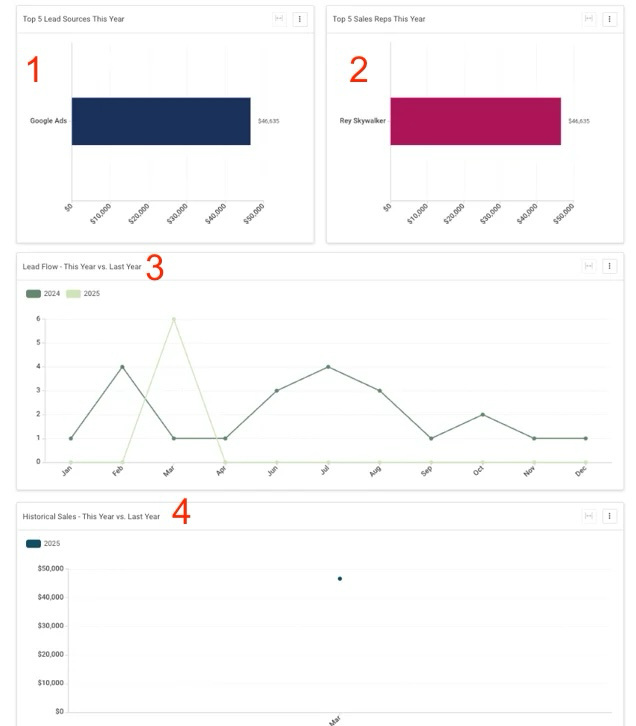
- Top 5 Lead Sources this Year: This chart shows the top five lead sources that have yielded the most revenue for your company this year.
- Top 5 Sales Reps this Year: This chart shows the top five Sales Reps that have brought in the most revenue this year.
- Lead Flow: This chart allows you to track peak activity and times when Lead conversion was at its best, giving you insight into how to best manage and prioritize your lead generation.
- Historical Sales: On this chart, you can see your sales trends and easily compare with your Lead Flow Report to gauge Lead success throughout the current year.
Filtering Data
There are two ways to filter data on your Business Overview dashboard.
The first is to narrow down the data by selecting options from the dropdown menus at the top of the page to focus on a particular Sales Rep, Job Type, or Lead Source.![]()
The second way to filter your data is by using Global filters. These can be utilized to apply changes across the entire page to further refine your data. To apply these filters, expand the filter menu (if needed) on the right -hand side of the screen by clicking on the arrow button. 
Click on the + button on the right hand side.
Click on the filters you would like to apply and fill in the necessary information. Then, select if you would like to apply to all your Insights dashboards or just the Business Overview. Once you have selected your filters, select apply at the bottom of the window.

For more detailed information on how to use Insights filters, click here.
Note: The date range filter cannot be adjusted on Business Overview and will always show for the current calendar year.