On This Page
Completed Jobs
The records that display in the Completed Dashboard are Jobs that have reached a Status in the Completed Stage.
Filters
At the top of the page, you will find a series of dropdown menus containing a number of filters.

- Completed Date allows you to adjust your data for the date range a Job was completed.
- Sales Rep allows you to filter your data by selecting the sales rep(s) you want see data for.
- Job Type allows you to filter your data by selecting from the list of Workflow names (or Job type names) such as Retail and Insurance.
- Lead Source allows you to filter your data by the lead sources that you have entered into your account, such as Facebook, Billboard, or Google Ads.
- Stage allows you to filter by what Stage your Jobs are in.
Completed Jobs Graphs
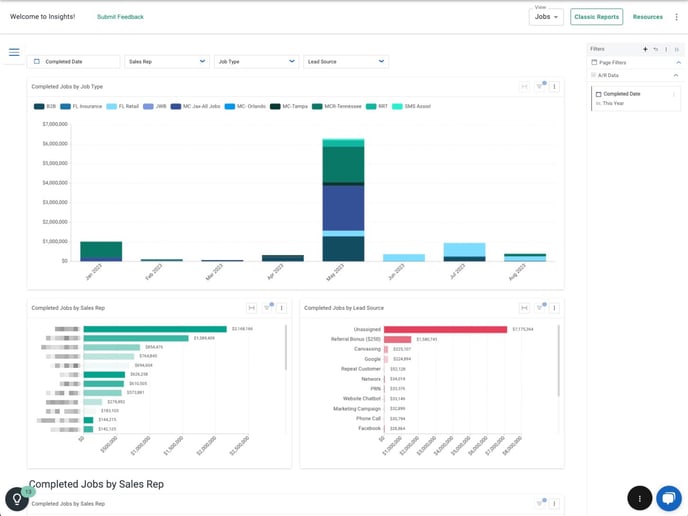
Completed Jobs by Job Type
The Completed Jobs by Job Type graph shows a month over month overview of Jobs that have been completed and have a Closed Invoice in their JobNimbus Financials.

Completed Jobs by Sales Rep
This graph shows which Sales Reps are closing the highest revenue deals, which provides insight into their performance.

Completed Jobs by Lead Source
This graph helps you to easily identify which Lead Sources are bringing in the most revenue.

Completed Jobs Scorecards
Completed Jobs by Sales Rep
See how your Sales Reps are performing side by side with a break down of their average revenue for completed jobs.

To add additional columns to the chart, click on the eye icon in the top right corner and select your desired column from the dropdown menu.

Completed Jobs by Lead Source
This scorecard provides an overview of the success rate of your Lead Sources complete with the average revenue for each of your listed Lead Sources.

As above, you can add new columns by clicking the eye icon the top right corner of the chart and selecting your desired column from the dropdown menu.
Completed Jobs by Job Type
Compare your Job Types (otherwise known as your Workflow name) to see the average deal size within each Job type and the overall incoming revenue.

As above, you can add new columns by clicking the eye icon the top right corner of the chart and selecting your desired column from the dropdown menu.
Raw Data
In this chart you will get a detailed report of all Completed Jobs including their invoice statuses, due dates, Invoice dates, parent Contacts, Accounts Receivable dates, Completed Dates, Job cities and zip codes, and their related Sales Reps.

As above, you can add new columns by clicking the eye icon the top right corner of the chart and selecting your desired column from the dropdown menu.