On This Page
Overview Video
Insights Filters
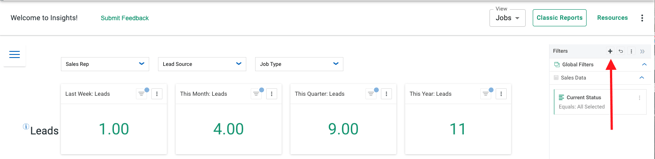
- To use filters for Insights, first navigate to the Insights tab on your JobNimbus navigation.
- Then, select the Filters menu on the right-hand side if it is not already expanded.

- This will show you the Filters currently applied to your Insights data.

Types of Filters
Global Filters
- Global Filters are filters that will reflect on all Dashboards in Insights. For instance, if we apply a Global Filter for Estimate Status, it will remain in effect even if we switch to a different Dashboard. This means that the filter will be applied consistently across all Dashboards.

Dashboard Filters
- Dashboard Filters apply to all Tabs on a Dashboard. For instance, if you apply a dashboard filter on the Sales Dashboard, the filter will will appear on the Leads/ Close Rate, Sales, Sales Pipeline, and Sales Data Tabs.

Tab Filters
- Tab Filters only impact the graphs and data on the individual tab. For example, if you apply a filter on the Sales Overview tab, that filter will not appear on the Sales or Lead/Close Rate tabs.

You can apply tab filters using the dropdown menus at the top of each tab or by selecting the Current tab from the Apply to dropdown in the Filters window.
Applying Filters
- To apply filters, select the filter you would like to use from the dropdown menus.

- Active filters will appear in the Filters menu on the right of your screen, where you can also access all filter options. If you click the + button in the top right corner, you can see all available filters.
-
When selecting filters, you have the option to apply them at the page or tab level using the Apply to dropdown at the bottom of the window.

- Once you have selected a filter, the window will reload to allow you to configure the filter settings.
Note: Be mindful of conflicting filters when applying filters. If you see filters for Approved Estimates AND Lost Sales, for example, no data will be available because these two filters contradict one another. If no data is displayed, review your active filters and make any necessary adjustments.
Managing Filters
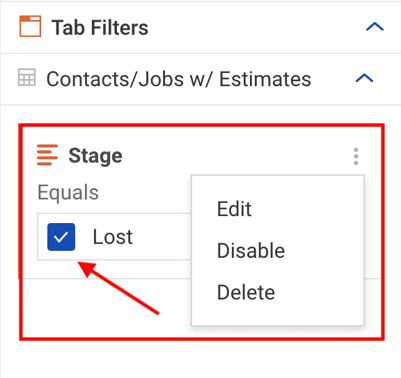
- You can use the checkboxes next to individual filters to quickly add or remove them, or click on the three dots on the top right corner and select Delete to remove them from the Filters list.
Filtering Through Charts
You can also filter your Insights reports by clicking the data on the charts on your reports pages.
- To filter through your charts, click on the category you want to filter by and select Filter by on the populated menu.

- Once you have clicked this, the filter menu on the right-hand side will show the filter that you have added.

- This filter will apply to all charts within the section you selected it in and will remain until you remove it from the Filter menu. For example, if you filter a chart in the Sales section, it will apply that filter to the rest of your Sales data, but not your Accounts Receivable data.