On This Page
Workflow Dashboard
On this page, you can easily track how fast jobs are being completed and have the data to quickly address productivity concerns so you can effectively plan production work.
To get to the Workflow tab, select the three lines in the top left of the Insights page, then select Workflow.

Here, you will find a number of metrics to help you track your Jobs as they move through your pipeline.

Filters
At the top of the page, you will find a series of dropdown menus containing a number of filters.

- Date Range allows to you adjust the date range for your data.
- Sales Rep allows you to filter your data by selecting the sales rep(s) you want see data for.
- Job Type allows you to filter your data by selecting from the list of Workflow names (or Job type names) such as Retail and Insurance.
- Lead Source allows you to filter your data by the lead sources that you have entered into your account, such as Facebook, Billboard, or Google Ads.
For more information on how to use filters on Insights, click here.
Time in Stage
Days in Stage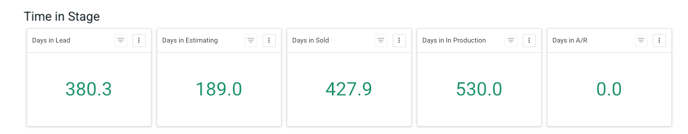
Days in Stage shows Individual charts that give you an easy to digest snapshot of the average number of days a Job spends in each Stage. The Stages included are Lead, Estimating, Sold, Production, and A/R (Accounts Receivable).
To see the Jobs that make up this aggregate data, click on the green number in the desired box. This will bring up a pop-up showing a report of all the Jobs that are contributing to the data. 
Time in Stage: Sales Rep
This chart offers a look at each Sales Rep's assigned Jobs' Stage. By default, the chart shows the Sales Rep name, the Stage Order (meaning the order the Stages appear in the corresponding workflows), the Stage name, the Average Days in each Stage, the number of days a Job has been in a Status that is associated with that Stage, and total number of Jobs in that Stage.

To add additional columns to the chart, click on the eye icon in the top right corner and select your desired column from the dropdown menu.
Time in Stage: Job Type
In the Job Type chard, you can find data regarding your Job Types and the number of Jobs in a particular Stage. By default, the chart shows the Stage Order (meaning the order the Stages appear in the corresponding workflows), the Stage name, the Average Days in each Stage, the number of days a Job has been in a Status that is associated with that Stage, and total number of Jobs in that Stage. As above, you can add new columns by clicking the eye icon the top right corner of the chart and selecting your desired column from the dropdown menu.
Time in Status
This chart shows which Status your Jobs are spending time in. You can use this data to identify areas where you can simplify and streamline your Workflows.

Raw Data
This chart shows a comprehensive list of all Jobs and their complete history, highlighting their current Stages and Statuses.
