On This Page
Insights is a reporting tool within JobNimbus that you can use to keep track of your Jobs, Sales, Accounts Receivable, Completed Jobs, and Profit Tracker statistics.
Business Overview
The first page that you will see when you click on the Insights tab is the Business Overview page.
Here, you will find an overview of your business' key metrics.

- Use the dropdown menus at the top of the screen to filter by Sales Rep, Lead Source, and Job Type.
- Download the data in any of the tables by clicking the three dots and selecting Download, then selecting the type of document you want to export it as.
- Leads account for jobs that entered the "Lead" stage during the given timeframe.
- To learn how Stages affect your Insights data, click here.
- Sold numbers on the Business Overview dashboard are based on sold jobs and the total of their related estimates in the "approved" or "invoiced" status.
- Please be aware that these numbers will only reflect correctly if you are updating your Estimates and moving them through the proper statuses. For more information about Estimate Statuses, click here.
- Close Rates show the percentage of leads collected in a given timeframe that moved to the "Sold" stage during that same timeframe.
- Estimating Conversion Rates show the percentage of jobs that entered the "Estimating" stage during a given timeframe and moved to the "Sold" stage within that same period of time.
Below this, you will see a set of graphs. These show the Top 5 Lead Sources This Year, Top 5 Sales Reps This Year, your Lead Flow comparing this year and last year, and your Historical Sales comparing this year and last year.

To get more information on the data in the graphs, click on either the bar in a bar graph or a single data point and select drill down to next level.
Sales
To get to the Sales tab, select the three lines in the top left of the Insights page, then select Sales.

Here, you will find several tabs that will provide detailed information on your Sales within your filter parameters.
Note:
- If you are unable to view any data in the Sales tables, please verify that you are utilizing JobNimbus Estimates.
- Examine your Workflows and watch for any None Stages, as this may affect your data analysis.
- To prevent deleted Estimates from appearing in the Sales tables, it is recommended to void unnecessary financial records which will zero out the values on the record. This will ensure that the record does not report in Insights.
Leads/Close Rate
The first section under Sales is the Leads/Close Rate.
The Close Rate is calculated by Insights by analyzing all the Leads collected during a specific time period and determining the number of Sold Jobs that came from those Leads.
Here, you will find graphs pertaining to your lead flow and lead mix (meaning the number of sales from each lead source), and scorecards showing your Lead/Close Rate by Sales Rep, Lead Source, and Job Type.

Scrolling further down the page will allow you to view Leads by Area as well as your Raw Sales Data.

Estimating Conversion
The second tab at the top of the Sales section of Insights is Estimating Conversion. This contains information regarding how many of your Jobs go from the Estimating stage to the Sold Stage within the given timeframe in your filters.
On this tab, you can find the percentage of your Estimating to Sold Rate, your Estimated Jobs (meaning Jobs that hit the Estimating Stage) within your filtered timeframe, and your Estimating Conversion by Sales Rep, Job Type, and Lead Source.

As in the previous tab, you will also find your raw data table at the bottom of the section.
Sales
The third tab in this section is the Sales tab. Insights calculates the total amount of sales by taking into account all Estimates for any Job that was sold during the specified time period, regardless of the status of the estimate.
Here, you can view your Historical Sales, Sales Leaderboard, and Sales by Sales Rep, Area, Lead Source, and Job Type.

As in the previous tab, you will also find your raw data table at the bottom of the section.
Sales Pipeline
The next tab in this section is the Sales Pipeline.
In this tab, you can find your Current Sales Pipeline by Stage, which shows the number of Jobs in each Stage.
You can also see your Outstanding Estimates by status and the total dollar amount of the Estimates in each status.

At the bottom of the page, you will see your Sales Data table, which contains the details of the Jobs and financials being reported on in this tab. 
Sales Data
On the Sales Data page, you will find the raw data for your Jobs and their financials.

- Opt to add or remove columns from this chart by clicking on the eye icon and selecting or deselecting each column option.
- Download the data table by clicking on the three dots in the top right of the chart and selecting download. Then, select the format you would like to download the chart as.
Workflow
To get to the Workflow tab, select the three lines in the top left of the Insights page, then select Workflow.

On the Time in Stage section, you can see the total number of days your Jobs have been in each stage in your workflows. You will also find data tables showing the Time in Stage by Sales Rep and by Job Type.
This feature calculates the time from when a Job or Contact enters a Stage to the time it exits that Stage. It works for all historical time frames, providing valuable insights into the time spent in each stage.

If you scroll further down on the page, you can find the data tables for Time in Status and Raw Data.

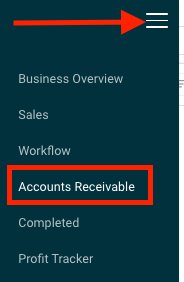
Accounts Receivable
To get to the Accounts Receivable tab, select the three lines in the top left of the Insights page, then select Accounts Receivable.
On this page, you can find the total amount of your Outstanding Invoices, Outstanding Invoices organized by status, the dollar amount of any overdue invoices by date range, and Invoice by Overdue Category (1-30 days overdue, 91+ days overdue, or not overdue).

Scrolling to the bottom of the page will show you a data table of your Accounts Receivable and Completed Jobs.
The following are the Invoice statuses that Insights reads data from.
-
Draft: This status refers to invoices that have been created but are not yet finalized or sent to customers. It is typically used when an invoice is still undergoing review or edits before it is ready to be sent. Insights allows you to easily track these pending invoices to ensure they are processed and sent to customers in a timely manner.
-
Open: Open status refers to invoices that have been sent to customers but have not been paid yet. These invoices are still awaiting payment and are considered outstanding. By monitoring the Open status, you can ensure that these pending invoices are followed up on and payment is collected within a reasonable timeframe.
-
Sent: When you email invoices to customers, they will be automatically moved to the Sent status. This status indicates that the invoice is no longer in the drafting phase and has been officially shared with the customer.
-
Cancelled: Cancelled is typically used when there is a need to retract an Invoice due to errors, changes in customer requirement, or any other reason that renders the Invoice invalid.
- Closed: The "Closed" status refers to invoices that have been fully paid and are no longer outstanding. This status indicates that all financial obligations related to the invoice have been met and there is no further action required giving you a clear overview of the invoices that have been settled.
-
Void: When you void an invoice, it means that the invoice is no longer valid and should not be considered for payment. By moving an invoice to the Void status, all values will be set to zero to ensure that they do not appear in any reports.
Completed
To get to the Completed tab, select the three lines in the top left of the Insights page, then select Completed.
Here, you will see graphs showing your Completed Jobs by Job Type, by Sales Rep, and by Lead Source. 
Below this, you will find your Completed Jobs by Sales Rep, Lead Source, and Job Type shown as a scorecard data table. 

As with other tabs, you will also find the raw data table at the bottom of the page.
Profit Tracker
To get to the Profit Tracker tab, select the three lines in the top left of the Insights page, then select Profit Tracker.

Profitability Summary
The first tab under this section is the Profitability Summary. Here, you can find information on your Planned to actual Gross (without commissions), Planned to Actual Net (with commissions), and the Number of Jobs Completed within a given timeframe.

Below this section, you will find graphs detailing your Planned to Actual Gross Margin, Planned to Actual Net Profit Margin, Planned and Actual Revenue Trended, Planned to Actual Total Net Costs. 
At the bottom of the page, you will find the Profitability by Lead Source data chart.

Profit & Loss
In the Profit and Loss tab, you will find charts detailing your Planned Profit and Loss as well as your Actual Profit and Loss.

Variance Analysis
In the Variance Analysis tab, you can view charts detailing your Variance Summary, Variance Summary by Salesperson, and Variance Summary by Job Type.


Sales and Commissions
The last tab in this section is the Sales and Commissions tab. Here, you can find a bar graph comparing your Salesperson Profitability.
Below that, you will find a report of Commissions Paid and Due listed with the Sales Rep's name, the Job Name, and commission information.

If you scroll further down the page, you will find the Paid Commissions as % of Revenue and Profit.
Below that, you will find a data table displaying the Profitability by Salesperson, which shows each salesperson's profitability compared to the Planned Gross Profit Margin, Planned Net Profit Margin, the Actual Gross Profit Margin, and the Actual Net Profit Margin.
